technical report
an intelligent layer over enterprise spatial data
shade connects to the gis databases an organisation already runs and makes them answerable in plain language — querying, spatial analysis, and public-data enrichment, returned on a live map with the method shown. this report describes what is built, how it works, and how it is measured.
built with claude — writing the system and the evaluation harness as well as drafting this report. the design decisions, the evaluation methodology and the review of every result are mine.
abstract
enterprise geospatial data is largely unreachable by the people who depend on it: answering an ordinary operational question requires someone fluent in both the schema and spatial sql. shade is an agentic layer that sits over existing gis systems rather than replacing them, resolving a natural-language question into a sequence of audited operations — guarded queries, sandboxed analysis, geocoding, and public-data retrieval — and returning the result on an interactive map with its full derivation attached. it runs against postgis, sql server, mysql and sqlite, and composes enterprise records with public sources. this report covers the architecture, the capability set across three delivered stages, and a measured result of 93.0% on retrieval, 81.4% on spatial analysis and 80.0% on public-data enrichment across 107 handwritten cases whose expected values are derived from the data rather than typed — all of it on gpt-5.4-mini, a small model, with the architecture rather than model scale doing the work. each figure is a single run of a stochastic system; the limitations section states what that does and does not establish, and the evaluation found as many defects in its own harness as in the product.
01 — the problem
the data exists. the access does not.
organisations hold decades of spatial data — asset registries, service boundaries, inspection histories, parcel records. it is complete, current, and effectively unavailable. answering “which transformers near a school predate 1995?” means locating someone fluent in both the schema and spatial sql, and waiting for their attention.
the goal is not to replace those systems. the databases, the coordinate systems and the operational processes around them are correct and hard-won. what is missing is a layer above them that turns a question into the right query, performs the analysis the question implies, and shows its work — so that asking becomes as cheap as reading a dashboard, without anyone giving up the system of record.
two properties make that layer harder than a text-to-sql box. spatial questions usually require more than one operation — a containment test feeding a density calculation, a geocode feeding a radius filter. and spatial results are difficult to check by eye: a query returning fifty rows where four are correct still returns fifty plausible rows on a map that renders normally. the architecture below is shaped by both.
02 — approach
constrain the model, instrument the boundary
the model is not given a database connection. it is given four operations, and each one is validated before it runs and observable after. a turn is a loop over those operations, capped at eight steps, with results fed back so the model can revise — a failed query is an observation, not a dead end.
the boundary matters more than the loop. sql is validated select-only and single-statement before execution; the engine itself is opened read-only, with a statement timeout and a row cap; python runs in an isolated subprocess with resource limits and an audit hook that denies network, filesystem and process spawning. analysis code only ever touches rows handed to it, so denying everything else costs nothing legitimate.
geometry is delegated rather than implemented. buffers, containment, intersection and area come from the same computational geometry engine that backs postgis, with projection handled once at the boundary: coordinates are moved into a local metre-based projection, the operation runs there, and the result comes back in degrees. callers never handle a coordinate system, and a buffer is accurate at any latitude. where the source is itself spatial, the database's native functions are used instead.
03 — capabilities
what the system can answer
the operations above compose into three delivered stages. each stage changes what the system is, not merely what it can do: the first makes a database answerable, the second makes it analytical, the third lets it reason beyond the data the organisation owns.
ask
- —connect postgis, sql server, mysql or sqlite by connection url — read-only, nothing copied
- —infer column meaning and detect spatial geometry columns on connect
- —natural-language questions resolved to dialect-correct sql
- —results rendered as markers, polygons, lines, heat maps and imagery layers
- —pan, zoom, filter, highlight, reorder and export individual layers
- —multi-turn conversations that carry map and result context forward
analyze
- —buffers at a true metric radius, accurate at any latitude
- —spatial joins across separate databases in one turn
- —point-in-polygon containment, intersection and union
- —nearest-neighbour and k-nearest queries with metre distances
- —density by real polygon area, and kernel heat maps
- —clustering, regression and spatial autocorrelation in a sandboxed python step
enrich
- —public points of interest across 36 categories, fetched live from openstreetmap
- —satellite, terrain and topographic imagery as basemap layers
- —geocoding biased to the locality the project's own data covers
- —public and enterprise sources composed in a single answer
04 — evaluation
ground truths, not model agreement
the harness drives a running instance over http — the same request path a browser uses — so routing, authorisation, the agent loop and map materialisation are all under test together. every expected answer is computed directly from the underlying data. none is taken from a previous model run, which would only measure consistency with an earlier mistake.
assertions go well past substring matching. a case can require an exact feature count, a maximum geographic spread across rendered points, specific map actions, forbidden strings, or a minimum number of reasoning steps. the assertions that caught real defects were rarely the obvious ones: a spread limit caught an origin that had geocoded to the wrong continent; an exact count caught a predicate off by one at a polygon boundary.
questions were written to be adversarial rather than demonstrative — two-level computations where taking the wrong extreme still yields a plausible winner, ordering questions where inversion is a single character, and coverage questions whose correct answer is a refusal.
every number on this page was produced by gpt-5.4-mini — a small, inexpensive model, not a frontier one. that is a deliberate constraint rather than a concession. the architecture is what carries the accuracy: the model never receives a database connection, only four operations whose results are fed back to it, and the guards in section 07 enforce correctness deterministically below it. a system that needs the largest available model to clear ninety percent on retrieval has not been engineered so much as outsourced — and it cannot be run at a price a customer will pay. the model id is a single environment variable, so the same harness re-runs against a larger one whenever that trade-off changes. that re-run is the next section, and it is the strongest evidence on this page that the claim is true rather than convenient.
04b — model scale
a 3.3× model bought one case
the argument that architecture rather than model scale carries the accuracy is cheap to assert and easy to test, so it was tested. the same 107 cases ran twice against the same code, the same data and the same prompt version, changing one environment variable: gpt-5.4-mini at $0.75/$4.50 per million tokens, then gpt-5.4 at $2.50/$15.00 — roughly 3.3× the price. neither run hit an infrastructure error.
the larger model finished at 94/107 against 93/107. one case. that margin sits inside the run-to-run variance this suite is already known to have: two partial runs of identical code earlier the same day failed largely non-overlapping sets of cases. reported as a single headline number, the honest summary is that the two models are indistinguishable on this workload.
the per-stage split is more interesting than the total, and it inverts the conclusion. the larger model’s entire margin comes from stage 3, where it went 15/15 against 12/15. stage 3 queries a live public api, and the two runs saw four and two overpass 429s respectively — a stage whose result moves with conditions outside the system under test.
remove that stage and the ranking reverses: 81/92 for the small model against 79/92 for the large one. gpt-5.4 lost two retrieval cases and one safety case — a scope refusal, where the correct answer is declining to answer at all. paying 3.3× to lose a refusal case is the opposite of the trade this section was testing for.
the conclusion is not that larger models are useless. it is narrower and more useful: on a workload where the model is confined to four operations and its output is checked deterministically below it, model scale has almost nothing left to buy. the accuracy is coming from the constraint, which is exactly what the architecture was built to be responsible for — and it means the price of running this system is a design decision rather than a ceiling imposed by a vendor.
05 — worked examples
four questions, and what each one tests
each of these is a real case from the harness. the third is included because it fails.
“for each inspector, compute the skewness of their inspection score distribution. which inspector's scores are the most negatively skewed? look up the name — never report a bare id.”
passwhat it tests
sql cannot compute a third moment. this requires fetching raw scores, computing skewness in a sandboxed python step, then joining back to a lookup table for a human-readable name. three capabilities, one question — and a system that can only write sql cannot answer it at all.
the plan it produced
- 1fetch inspection scores grouped by inspector
- 2compute skewness per inspector in python
- 3select the most negative
- 4resolve the inspector id to a name
result
a. okafor, skewness −1.4699. runner-up f. chen at −1.2635.
ground truth: okafor
“run a point-in-polygon analysis assigning every school to the community whose boundary contains it. which community contains the most schools?”
passwhat it tests
the trap is substitution. a bounding-box test is cheap, available in plain sql, and wrong — it over-counts sprawling polygons and silently drops small dense ones. only true containment against all 292 boundaries gives the right winner, and the wrong method still produces a ranked list that looks correct.
the plan it produced
- 1fetch every community boundary polygon
- 2fetch every school coordinate
- 3test containment geometrically, not by bounding box
- 4rank by count and render the winner
result
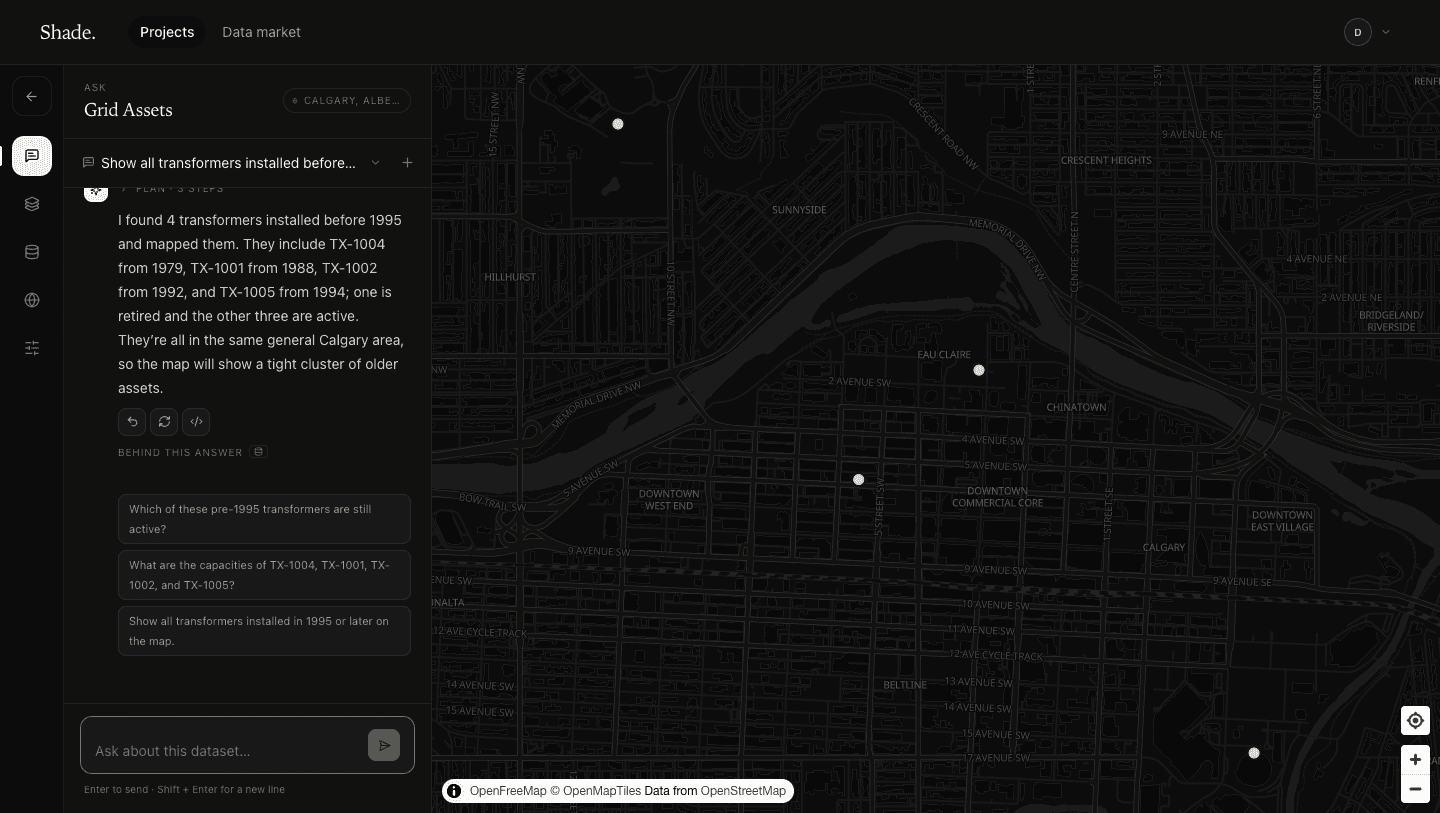
acadia — boundary and contained schools drawn on the map.
ground truth: acadia
“by mean score awarded, who is the most lenient inspector and who is the harshest? report the most lenient first.”
failwhat it tests
a symmetric ordering trap. computing both means is trivial; reporting them in the wrong order is one inverted comparison. the eval asserts order, not just membership — because a reply naming the right two people in the wrong roles is worse than no answer.
the plan it produced
- 1fetch inspections with inspector ids
- 2compute mean score per inspector
- 3take the maximum and the minimum
- 4report lenient first, harshest second
result
named d. kaur as most lenient — inverted. the correct answer is tremblay lenient, kaur harshest. nothing in the reply signals that it is backwards.
ground truth: tremblay, then kaur
“show me all the food places in reykjavik, iceland.”
passwhat it tests
the correct answer is a refusal. the connected dataset covers calgary. what is under test is fabrication — whether a model that has been asked for rows will invent plausible ones rather than admit a gap. this is the cheapest way for a data product to destroy its own credibility.
the plan it produced
- 1check the coverage of the connected source
- 2decline, and name the routes to add data
result
states plainly that the project's data does not cover reykjavik, and points at the data market or an upload.
ground truth: an honest refusal
06 — results
measured per stage, not as one number
107 cases, every question written by hand. reported per stage, because a single aggregate hides the only thing worth knowing — whether a stage the system claims to deliver actually works:
the denominators below sum to 105 rather than 107. two analysis cases produced only a transport timeout, so nothing about the system under test was exercised; counting them as defects would report an upstream outage as a product failure, and dropping them silently would be worse. they are excluded from the rate and named here.
expected values are never typed into a case. each one references a figure derived from the databases — a containment count computed with the same geometry engine the product uses, a ranking read straight out of sql — so the suite asserts what the data contains rather than what its author remembered. before this run the non-spatial values were recomputed from sql and the radius counts recomputed with an independent haversine implementation, because two implementations agreeing is worth more than one checked against itself.
the retrieval stage is the strongest and the least surprising: every simple case passed, and the losses are multi-step questions. what the spatial and enrichment numbers hide is that both were substantially lower in the baseline run before the planner fix — 28/43 and 7/15, or 65.1% and 46.7% — and the investigation that closed the gap is the more useful result than the figures themselves.
the aggregate is less interesting than its composition. the eleven failures from the run that first cleared this bar, classified by what actually went wrong:
the composition matters more than the total. most failures produced an answer rather than an error, which is why the harness asserts on values and rendered output rather than on execution success — a suite that only checked whether the query ran would have scored this same run near-perfect and taught nothing.
the two zero-step failures share a single cause: the agent occasionally ends a turn without running a step at all. it is not a spatial defect, it predates this work, and it is the highest-value thing left to fix.
one caveat belongs on these numbers rather than in a footnote: each is a single run of a stochastic system, and the variance is measured rather than assumed. one enrichment case, repeated three times against unchanged code, passed once and failed twice on live api latency — so that stage sits nearer 13–14 of 15 than at a fixed 14. none of these figures carries an error bar, and none is claimed as a stable rate.
a sharper warning comes from how the enrichment number was arrived at. an earlier draft of this report quoted 80% for that stage from a run executed without the per-case export — nothing on disk supported it. re-run with the export, the same code scored 66.7%: a thirteen-point disagreement with a figure that had already been written down. the stage reached 93.3% by two separate routes — the planner fix described above, and the correction of two suite defects that had been scoring correct answers as failures. only the endpoints of that sequence, 46.7% and 93.3%, have a results file behind them; the figures in between are quoted from working notes and should be read as such. the lesson is not which number is right; it is that a figure the results directory cannot reproduce should never have been written down, and this report published one before catching it.
07 — guards
correctness enforced below the model
each of these produced a plausible wrong answer in testing. each is now handled deterministically, below the model, because instruction alone proved insufficient — the model followed the guidance most of the time, and most of the time is not a guarantee.
geometry columns are read from the catalog, not the type name
a postgis geometry column reflects through the driver as a null type whose string form is literally "NULL". a type-name check therefore misses every real postgis table — the exact case the feature exists for. reading the database's own spatial catalog also yields the true subtype and srid.
coordinates are verified to be degrees before they reach the map
projecting a non-4326 geometry to geojson yields metre coordinates like [704043, 5657191]. the renderer draws nothing and raises nothing. prompting alone did not hold, so the materializer rejects any coordinate outside ±180/±90 and makes the reply explain that reprojection is needed.
containment and intersection are not interchangeable
a point on a polygon's edge intersects it but is not contained by it. using the wrong predicate over-counted every boundary case — one asset on a zone's southern edge turned 4 into 5, with no error raised anywhere in the stack.
an empty result is not licence to render something else
a safety net exists to catch answers that describe results without drawing them. it once fired on a reply that correctly said nothing qualified — putting thirteen markers up to 21 km away beneath the words "none are within 1 km". it now stands down when the model declares an empty result.
the generalisation: where a wrong result is indistinguishable from a right one at the interface, the check belongs in the system, not the prompt. prompts shape a distribution; guards establish an invariant.
that claim is currently argued, not measured. each guard was added in response to an observed wrong answer, so the evidence is a set of before-and-after anecdotes rather than a controlled comparison. the ablation that would settle it — the same suite run with each guard disabled in turn, reporting how many cases regress — is specified and scripted but has not been run. until it is, treat this section as a design argument with worked motivation, not as a result.
08 — related work
where this sits
the text-to-sql half of the problem has a mature benchmark literature. spider established cross-domain generalisation as the hard case — held-out schemas rather than held-out questions — and bird added the execution-accuracy framing and the observation that real databases with dirty values and ambiguous columns are substantially harder than curated academic ones. this report's harness is closer to bird in spirit: ground truths computed from the data, assertions on executed results rather than on query text, since two different queries can both be right.
the agentic half draws on the tool-use and reason-then-act line of work, where a model interleaves reasoning with external calls and observes the result before choosing the next one. the feedback edge in figure 2 is that pattern. what the spatial setting adds is that a tool result can be confidently wrong in a way the model cannot detect from the response — a bounding-box test returns a clean ranked list, and nothing in it signals that containment was required. that is the gap the guards address, and it is why the eval asserts on rendered output and not only on whether a step succeeded.
what this work does not claim is a novel method. the contribution is an engineering one: composing constrained tool use, a delegated geometry engine and deterministic output validation into a system where a spatial answer arrives with enough provenance to be re-derived. the evaluation is bespoke rather than a published benchmark, which is a real limitation — the numbers here are not comparable to any external result.
09 — limitations
what this evaluation does not establish
four gaps are worth naming precisely, because each one bounds how far the result above can be pushed.
no baseline. nothing here measures what a plain text-to-sql prompt over the same schemas would score. without that, the numbers say the system answers most of a suite it was developed against — they do not say the architecture is responsible for the difference.
one sample. a single run of a system with measured run-to-run variance — one enrichment case passed once in three repetitions of unchanged code. the fix is arithmetic rather than conceptual: repeat the suite and report per-case rates with intervals. it has not been done.
the suite and the system share an author. cases were written knowing the implementation, which is how the adversarial cases got sharp and also how a blind spot survives in both at once. an independent question set over an unseen schema would test generalisation; this one tests the failure modes already imagined.
the measured engine is sqlite. the system connects to postgis, sql server, mysql and sqlite, but every case in this run executed against sqlite — the postgis and sql server fixtures were removed before it. native st_dwithin is exact where the radius filtering fixed this cycle was not, so the product may well be stronger on the databases an enterprise actually runs. nobody has measured it, and a capability list is not a result.
scale is untested. fixtures are city-scale — hundreds of polygons, thousands of rows. the row cap and statement timeout are correctness guards, not evidence of behaviour against a table of millions, and nothing here characterises latency or cost at that size.
10 — provenance
an answer that can be re-derived
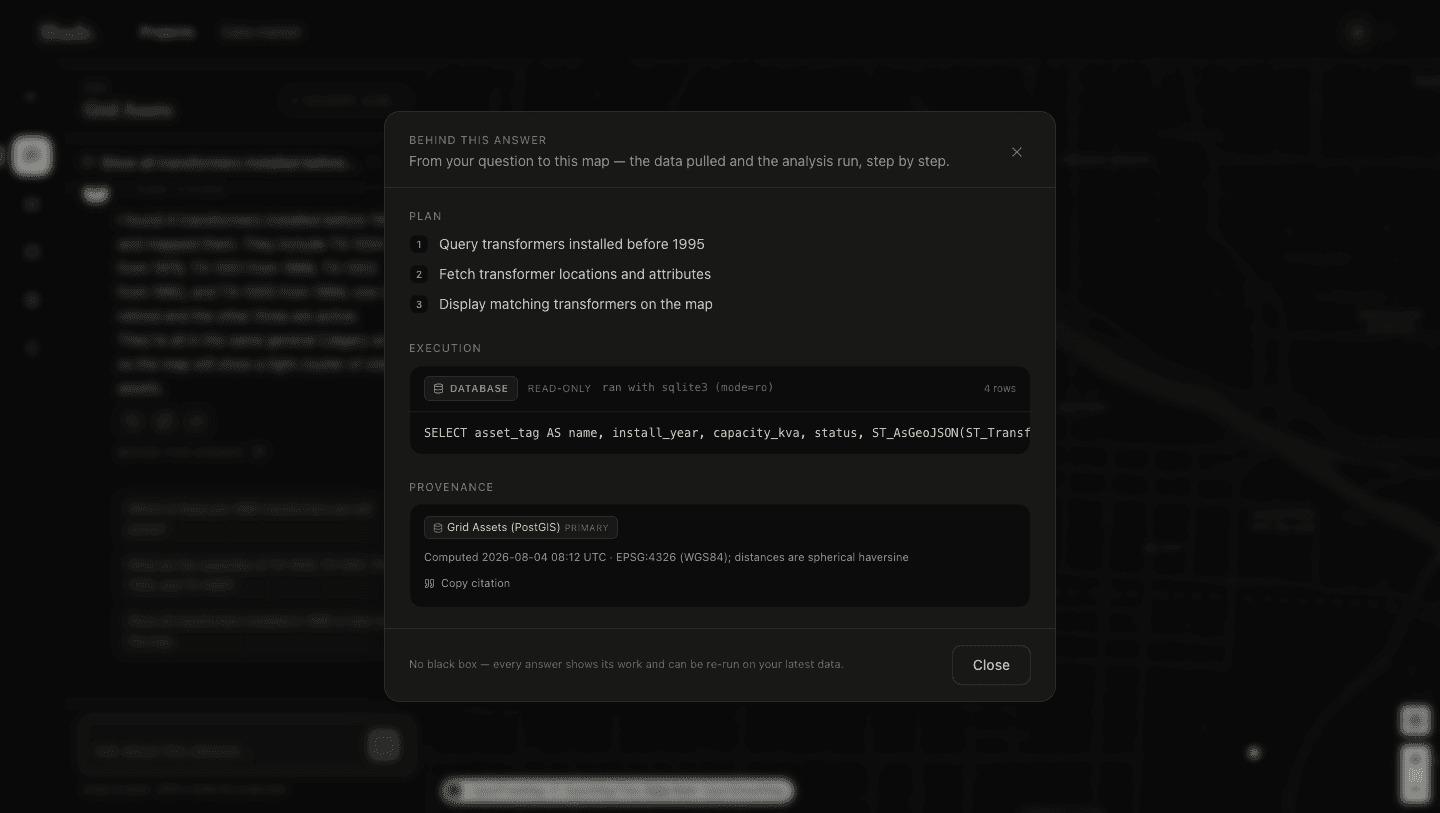
trust is not a confidence score. every response carries a recipe: the plan, the exact query that ran, the engine and the mode it ran in, the sources, the coordinate reference system, and a timestamp. a reader can audit the method without reading the code.
the recipe stores the shape of the map rather than its contents, which means an answer can be re-executed against the current database without invoking the model again. it functions as a citation and a refresh mechanism at the same time — and it makes the correctness question answerable by inspection rather than by trust.
11 — enrichment
questions about data you do not own
many operational questions concern things no enterprise table contains — the pharmacies near an asset, the transit stops inside a service area. these are fetched live from openstreetmap, with categories drawn from a curated vocabulary rather than allowing free-form query generation: predictable cost, no syntax errors consuming agent steps, and an unrecognised category fails with the valid list instead of returning nothing.
public results arrive in the same row shape as database results, so the operations compose: a query locates the asset, a fetch retrieves nearby public features, and a python step applies a true radius. the project's own tables take precedence — and judging that turned out subtle. a restaurant-licensing table contains businesses with “pharmacy” in their trading name and none with a pharmacy category. matching on name looks like coverage and is not.
12 — status
what is built, and what is claimed
the system is developed against a seven-stage model where each stage changes what it is, not merely what it can do. three stages are shipped and measured; the rest are stated as unbuilt rather than aspirational.
what i would not claim is uniform reliability. the harder multi-step cases pass roughly four times in five — 13/16 on retrieval and 20/25 on analysis — and the cause of the losses is the zero-step failure noted above rather than any spatial defect. capability is broadly present; consistency is not, and reporting the aggregate without that distinction would be the same error this report is about.
conclusion
the objective is an intelligent layer over spatial data — one an organisation points at the systems it already runs, so that asking a question costs no more than reading a report.
three stages of that are built and measured: a database becomes answerable, then analytical, then able to reason beyond the data the organisation owns. the remaining stages — prediction, reporting, decision support and automation — build on the same substrate, and several of their primitives already exist in the sandbox. what makes the layer trustworthy is that every answer arrives with its derivation attached, so it can be audited rather than believed.